
It’s a story every restaurant owner knows all too well: the dining room is packed, tickets are flying, but when you look at the bank account at the end of the month, the numbers just don’t add up. If you're tired of running on thin margins, there's one core metric you absolutely have to master.
The food cost percentage formula is what separates the thriving restaurants from the ones just scraping by. It's the tool that shines a light on your spending and shows you exactly how much of every dollar earned is going right back into ingredients.
Why Your Food Cost Percentage Is a Critical Health Metric
For many operators, calculating food cost percentage feels like a chore—just one more thing on a never-ending to-do list. But it's time to shift that mindset. This isn't just accounting homework; it's the most powerful diagnostic tool you have for gauging the financial health of your entire operation.
This single number tells you if your menu is actually profitable, if your kitchen is running efficiently, and whether your supplier deals are as good as you think they are.
Without it, you're essentially flying blind. That best-selling pasta dish everyone raves about? It could be secretly losing you money on every plate. This is exactly where the food cost percentage formula brings much-needed clarity. It’s a foundational metric that has been at the heart of restaurant financial tracking for decades, and for good reason. The formula—your Cost of Goods Sold (COGS) divided by total food sales, then multiplied by 100—is the ultimate benchmark for operational efficiency. You can find more details about this essential restaurant metric on Lightspeedhq.com.
Beyond the Numbers: The Power of Real-Time Insights
Crunching the numbers weekly on a spreadsheet is a decent start, but it’s always reactive. You’re looking at last week’s problems instead of solving today’s. This is where a modern restaurant platform like TackOn Table changes the game entirely, turning a backward-looking task into a source of immediate, automated insight.
Instead of getting buried in paperwork and invoices, you can get a live, up-to-the-minute view of your business. Imagine being able to:
- See Your Live Food Costs: Know your exact food cost percentage for the day, week, or month without touching a calculator.
- Make Smarter Menu Decisions: Instantly identify your most profitable dishes versus the ones that are draining your margins, allowing you to re-price or re-engineer them.
- Control Inventory with Precision: Get automatic alerts when you’re running low on key ingredients, which helps you stop over-ordering and slash expensive food waste.
With its easy setup and mobile POS, TackOn Table puts these powerful tools in your hands, whether you're running a single food truck or a chain of cafes. Its affordability and simplicity give you the clarity to make proactive decisions that directly boost your bottom line, transforming a once-dreaded calculation into your biggest strategic advantage.
Breaking Down the Food Cost Percentage Formula
If you want to get a real handle on your restaurant's finances, you have to get comfortable with the numbers. The food cost percentage formula can look a bit intimidating, but it’s actually a pretty simple calculation once you know what goes into it. Think of it as telling the financial story of your inventory over a set period, like a week or a month.
The first piece of the puzzle is figuring out your Cost of Goods Sold (COGS). This isn't just what you paid your suppliers; it’s the value of the inventory you actually used to make the food you sold.
The Components of Your COGS
To nail down your COGS, you need to pull together three key numbers. Each one is essential for getting an accurate picture of your kitchen's financial performance.
- Beginning Inventory: This is the total dollar value of all the food and drinks you had sitting on the shelves right at the start of the period.
- Purchases: This is simply the total value of all the new inventory you bought from your suppliers during that same timeframe.
- Ending Inventory: Finally, this is the total dollar value of whatever inventory you have left over at the very end of the period.
Once you have these three figures, you can pinpoint the exact cost of the inventory that went out the door.
The formula for COGS is pretty straightforward: Beginning Inventory + Purchases – Ending Inventory = Cost of Goods Sold
This little equation tells you exactly how much your ingredients cost for the dishes you served. After you've got your COGS, you're just one step away from finding your food cost percentage.
This diagram really helps visualize how all the numbers flow together, from calculating COGS all the way to the final percentage.
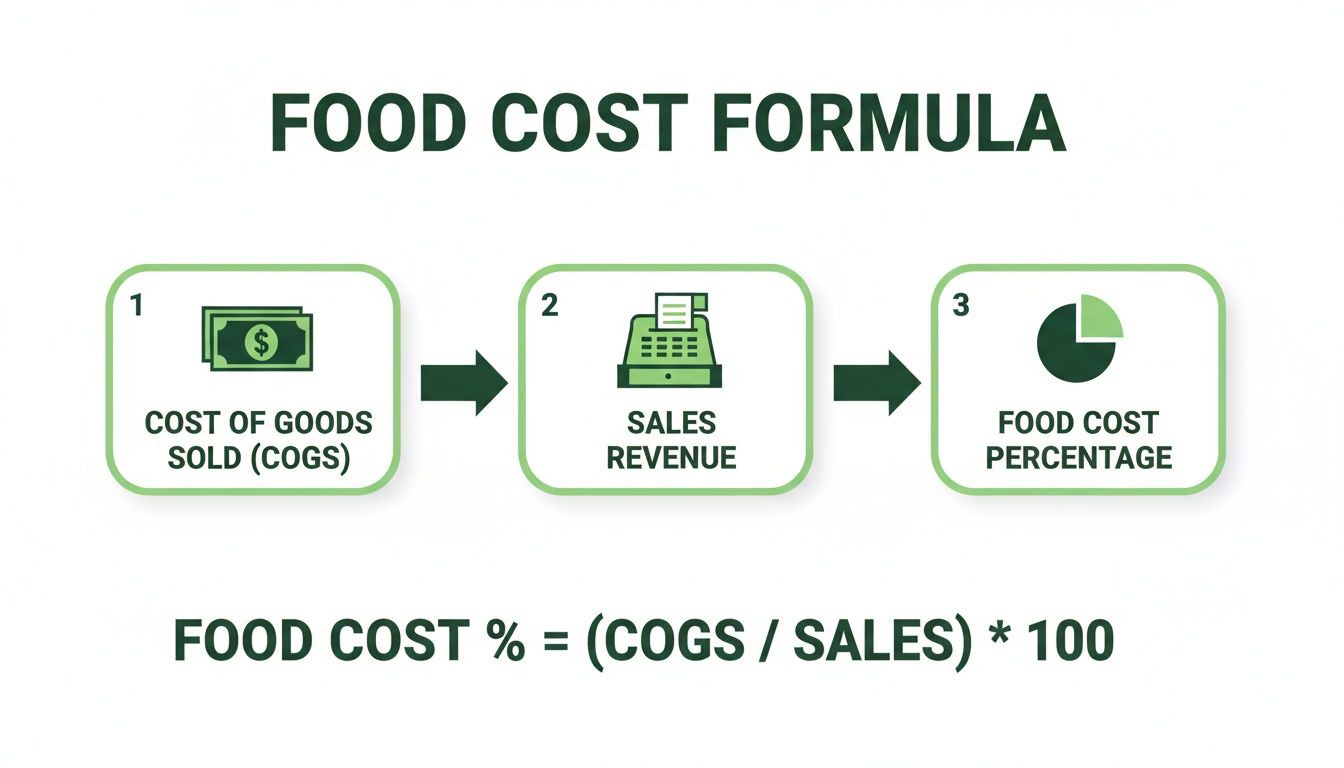
As you can see, getting that COGS number right is the critical first step. Only then can you compare it to your sales and see how you’re really doing.
Putting the Formula into Action
Let's walk through an example from the real world. Say you run a bustling downtown café and you want to calculate your food cost percentage for the month of April.
First, you need to find your COGS:
- You started April with $15,000 worth of stock (Beginning Inventory).
- Throughout the month, you bought another $8,000 in ingredients (Purchases).
- When you did your count at the end of April, you had $17,000 in inventory left (Ending Inventory).
So, your COGS calculation looks like this: $15,000 + $8,000 - $17,000 = $6,000.
Next, you check your sales data. A quick look at your POS shows you brought in $20,000 in food sales for April.
Now you have everything you need for the final formula: ($6,000 COGS / $20,000 Food Sales) x 100 = 30%.
Your food cost percentage for April was 30%. It’s amazing how much this one number can impact your bottom line. Even tiny adjustments can make a huge difference to your profits.
Of course, while the math itself isn't hard, gathering all this data manually can be a major headache. One misplaced invoice or a simple miscount during inventory can throw your entire calculation off, leading you to make bad decisions on everything from menu pricing to purchasing.
This is where having an all-in-one system like TackOn Table really pays off. Our platform automates your inventory tracking and connects it directly to your sales data, calculating COGS for you in real-time. It takes all the guesswork and late-night inventory counts out of the equation, giving you accurate, up-to-the-minute numbers so you can focus on what you do best.
Curious about how much time and money you could get back? Play around with our restaurant savings calculator to see the potential impact for yourself.
Using Food Cost to Build a Smarter Menu
Getting a handle on your restaurant's total food cost percentage is a great start, but that's just the big picture. The real power comes from drilling down and applying that same formula to every single item on your menu. This is where you shift from just tracking expenses to actively engineering a more profitable business, one plate at a time.
Think of it this way: your overall percentage tells you if you have a problem. The per-dish percentage tells you exactly where that problem is. This granular view is what uncovers your menu's hidden superstars—the true profit drivers—and flags the dishes that might be secretly eating away at your margins. It’s the difference between knowing your ship is taking on water and knowing precisely where to patch the hole.
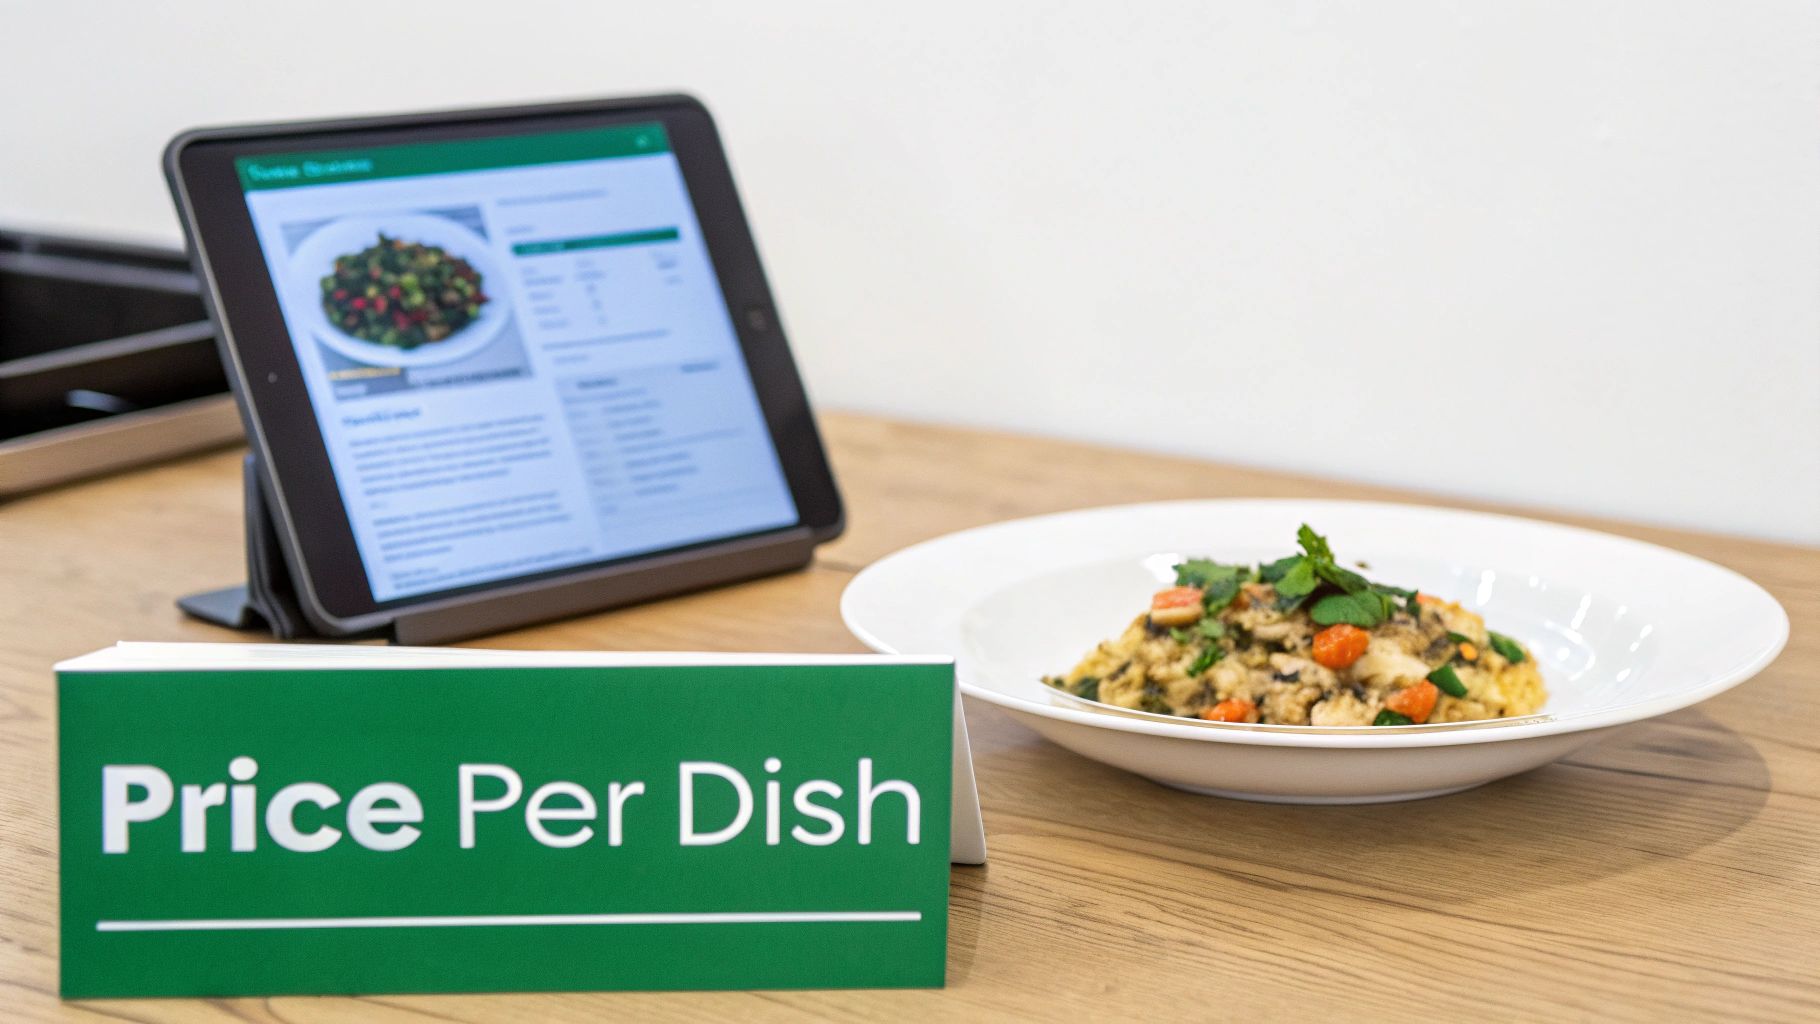
From Bulk Ingredients to Per-Dish Costs
To price anything on your menu correctly, you first have to nail down its plate cost. This means you need to know the cost of every last component in the recipe, right down to the pinch of salt and the sprig of parsley for garnish. Knowing these individual dish costs is fundamental, and using a Cost of Recipe Calculator Free can make the process much smoother.
Let's walk through a classic example: your signature burger. You'd need to break down the cost for every piece of it.
- The beef patty: If a 5lb package of ground beef costs you $25 and you get ten 8oz patties from it, each patty costs $2.50.
- The bun: A dozen brioche buns run you $6.00, so each bun is $0.50.
- Toppings: You'd do the same for the cheese, lettuce, tomato, and your special sauce, calculating the cost per slice, leaf, and ounce.
Once you add it all up, you might find your total plate cost comes out to $4.20. This number is your starting block—it’s the absolute minimum cost you need to cover before you can even think about profit.
Setting the Perfect Menu Price with Café Management Software
With your plate cost in hand, you can now set a menu price that actually supports your business goals. It’s a simple matter of working backward from your target food cost percentage. If you’re aiming for a 30% food cost on entrees, the formula is straightforward:
Menu Price = Plate Cost / Target Food Cost Percentage
Using our burger example, the math would look like this: $4.20 / 0.30 = $14.00.
This approach takes all the emotion and guesswork out of pricing. You're no longer just picking a number that feels right; you're setting a price based on hard data. This isn't just theory, either. We see it in action all the time. One of our clients, a small cafe, used this exact method for a new appetizer. Their plate cost was $2.75, and they were targeting a 26% food cost. By working backward, they confidently priced the dish at $10.50 and hit their margin goals from day one.
Of course, keeping up with fluctuating ingredient prices for every single recipe can feel like a full-time job. This is where an integrated system like TackOn Table really shines. Our Café Management Software includes recipe management tools that automatically update your plate costs whenever a supplier changes their pricing. You get a real-time view of each dish's profitability, making it easy to spot your menu's 'stars' and duds instantly. It gives you the clarity to make smart, profitable decisions without getting lost in a sea of spreadsheets.
Proven Strategies to Lower Your Food Cost Percentage
Knowing the food cost percentage formula is step one. Actually lowering it is where you start making real money. The good news is that shrinking this key metric doesn't mean you have to start sacrificing the quality your guests love. It's all about building smarter, more efficient habits in your kitchen to cut down on waste and get the most out of every single ingredient you buy.
Let's move past the theory and get into practical strategies that will directly boost your bottom line. By focusing on precision and using the data you already have, you can make a serious impact.
Master Your Portion Control
If you're looking for the fastest way to inflate food costs, inconsistent portioning is it. A little extra cheese on one dish or a heaping scoop of fries on another might not feel like a big deal in the moment. But trust me, those tiny variances bleed thousands of dollars in profit over the course of a year. Strict portion control isn't just a good idea—it's non-negotiable for a healthy food cost percentage.
This means giving your team the right tools for the job and training them to use them every time.
- Digital Scales: Make them mandatory for high-cost items like proteins and cheeses. Every plate needs to be the same.
- Portioning Tools: Use designated ladles for sauces and soups and specific, measured scoops for every side dish.
- Visual Guides: Post photos in your prep areas that clearly show what a finished, perfectly portioned dish should look like.
Getting this level of precision right not only keeps your costs in check but also delivers a consistent, reliable experience for your guests every single time they walk through the door.
Optimize Your Purchasing and Supplier Relationships
Your relationship with suppliers is a partnership, and it has a direct line to your costs. If you're just accepting list prices without any conversation, you're leaving cash on the table. Building an efficient procure-to-pay process is one of the most fundamental ways to tackle and lower your food cost percentage from the very start.
Take a hard look at your purchasing habits on a regular basis. Are you buying in bulk where it saves you money? Are you getting competitive bids from a few different vendors? Don't hesitate to renegotiate contracts or check out new local suppliers who might offer better prices or higher-quality products.
Leverage Sales Data to Minimize Waste with Your Restaurant POS
Food waste is the silent killer of restaurant profitability. It directly drives up your COGS without bringing in a single dollar of revenue. Your best weapon against waste is your own sales data, which can guide your ordering and prep decisions. A modern Restaurant POS like TackOn Table gives you the insights to stop guessing what you need and start knowing.
By analyzing your sales trends, you can forecast demand with incredible accuracy. This prevents you from over-ordering perishable items that just end up in the trash, turning your POS system into a profit-generating machine.
With TackOn Table, you can easily spot which menu items are flying out the door and which ones are collecting dust. Our system delivers clear, simple reports on what's selling, helping you make much smarter inventory decisions. For full-service restaurants, this kind of insight is critical for managing large, complex menus and cutting down on spoilage across dozens of ingredients.
The platform’s inventory management tools can even send you low-stock alerts. This prevents spoilage from over-ordering while making sure you never have to 86 a popular dish on a busy Friday night. It's an all-in-one simplicity that makes TackOn Table a powerful, affordable, and adaptable solution—a real advantage over more complex systems like Toast or Clover.
Ready to see how real-time data can transform your restaurant's profitability?
Book a Demo with TackOn Table
How a Modern Restaurant POS Puts Profitability on Autopilot
Let's be honest: wrestling with spreadsheets and digging through a mountain of invoices to calculate your food cost is a nightmare. It’s a slow, tedious process that’s guaranteed to have a few errors. Worse, you're always looking backward, trying to fix last week's problems instead of getting ahead of them.
To really nail your profitability, you have to move from being reactive to proactive.
The good news is that we've moved past the days of manual ledger entries. Today’s technology gives you the tools to take real control. As trends show, the industry has embraced real-time analytics powered by modern POS systems, which completely changes the game for managing your bottom line. You can see more on how tech is transforming restaurant cost tracking on USFoods.com.
This is exactly where an all-in-one platform like TackOn Table becomes your secret weapon. It ditches the manual headache by connecting all the pieces of the profitability puzzle for you.
A Single Source of Truth for Your Numbers
TackOn Table links your sales data, inventory levels, and purchasing records into one powerful, unified system. It works quietly in the background, giving you insights that used to take hours of painstaking work to uncover.
- Automated COGS Calculation: Every time you sell a dish, the system automatically deducts the ingredients from your inventory. It calculates your Cost of Goods Sold in real-time, meaning no more late-night inventory counts.
- Live Food Cost Dashboards: Why wait a week to know your numbers? Log in anytime and see your exact food cost percentage for the day, week, or month. You can spot a problem and fix it before it gets out of hand.
- Smart Low-Stock Alerts: Get automatic notifications when key ingredients are running low. This is a lifesaver—it prevents you from over-ordering expensive items that might spoil and stops you from having to 86 a popular dish during a dinner rush.
By automating the food cost percentage formula, you free up your time to focus on what truly matters: improving your menu, training your team, and delivering an unforgettable guest experience.
For operators running more than one spot, this kind of control isn't just nice—it's essential. TackOn Table’s multi-location control lets you see and compare how all your restaurants are doing from a single dashboard. You can instantly spot which locations are crushing their goals and which ones might need a little extra support, all without leaving your office.
This simple, powerful approach gives you a real edge. While some complex Toast vs Clover alternatives can feel overwhelming and break the bank, TackOn Table delivers straightforward tools that provide immediate value. Our easy setup and mobile POS help you make smarter, data-backed decisions that put more money in your pocket. You can learn more in our guide comparing TackOn Table vs Clover and Square.
Ready to stop guessing and start knowing?
Start Your Free Trial with TackOn Table
It’s Time to Take Control of Your Restaurant’s Bottom Line
Mastering your food cost percentage isn't just a numbers game—it's one of the most fundamental things you can do to secure your restaurant's future. When you learn to turn all that raw data from your kitchen and sales reports into smart, strategic decisions, you gain real power over your business. It's how you nail your menu pricing, slash expensive waste, and ultimately build a more resilient, profitable restaurant.
Of course, having the right tools makes all the difference.
Stop getting bogged down chasing numbers in endless spreadsheets and start focusing on what really matters: driving profitability. An all-in-one platform like TackOn Table can automate all those complex calculations for you, delivering the clarity you need to actually improve your margins. With a modern mobile POS and simple multi-location management built right in, you can run your entire operation with confidence.
Ready to take full control and see how TackOn Table can help you succeed? Discover a simpler, more affordable way to manage your restaurant.
Book a Demo Today
Got Questions? We've Got Answers
You're not alone. Restaurant owners and managers ask us about food cost all the time. Here are some of the most common questions that come up.
What’s a Good Food Cost Percentage to Aim For?
The industry standard benchmark usually lands somewhere between 28% and 35%, but honestly, "good" really depends on your concept.
A fast-casual spot slinging burgers and fries might aim for that leaner 25-30% range. On the other hand, a fine-dining restaurant working with premium, hard-to-source ingredients could be perfectly healthy with a food cost closer to 32-38%.
The most important thing is that your number leaves enough room for profit after you pay your staff, your rent, and all your other bills.
How Often Should I Be Running These Numbers?
At a bare minimum, you should be calculating your food cost percentage every single week. Doing it weekly gives you a fighting chance to catch problems—like a sudden spike in chicken wing prices or a pattern of kitchen waste—before they do serious damage to your profit and loss statement.
Of course, if you have an integrated system like a modern Restaurant POS, you can get this data daily, or even in real-time. That's the real game-changer. It lets you stop reacting to last week's problems and start making smart decisions for today's service.
Can I Actually Lower My Food Cost Without Cheaping Out on Quality?
Yes, absolutely. This is a huge misconception. Lowering your food cost isn't about switching to lower-grade ingredients; it's about being smarter and more efficient behind the scenes.
Think about it this way. You can make a serious dent in your costs just by focusing on a few key areas that have nothing to do with what’s on the plate:
- Building better relationships with your suppliers to get a better price.
- Getting serious about portion control, especially for your most expensive items.
- Using your own sales data to see what’s selling (and what’s not) to avoid over-prepping.
- Engineering your menu to draw more attention to your most popular and profitable dishes.
None of these tactics touch the quality your guests know and love. They just make your operation sharper.
Ready to stop crunching numbers in a spreadsheet and start making more money? A platform like TackOn Table automates all of this, giving you the clarity you need to master your food costs for good.
Book Your Free Demo to Learn More
See how TackOn Table works for your restaurant. Same-day call →