
Think of restaurant industry ratios as your business's vital signs. They’re the standardized metrics that cut through the daily noise to show you what’s really working, what’s broken, and where your biggest opportunities are hiding. These key performance indicators (KPIs) measure everything from cost control and profitability to operational efficiency. With clarity and authority, we'll guide you through using them to manage your restaurant, café, or food truck.
Going Beyond Daily Sales to Measure Restaurant Health
Just looking at your daily sales report is like checking a car's speedometer. It tells you how fast you're going at that exact moment, but it tells you absolutely nothing about the engine's health or how much fuel is left in the tank. To get the full picture, you need a complete set of diagnostic tools.
That's where industry ratios come in. They give you a clear, standardized way to measure what truly matters and help answer the critical questions that daily sales figures can't touch:
- Are my food and labor costs secretly eating away at my profits?
- Is my menu actually priced to be profitable?
- How efficiently is my team really serving our guests?
- Is my inventory turning into cash, or is it just spoiling on the shelf?
Tracking these numbers helps you shift from simply reacting to the day's totals to proactively managing the financial health of your business. In an industry this competitive, a data-driven approach isn't a luxury—it's a necessity. The global fast-food market is expected to hit $1.1 trillion by 2025, yet the field is so crowded that no single company commands more than a 5% share. When you're dealing with razor-thin margins and high turnover, efficiency is the name of the game.
Turning Data into Decisions with TackOn Table’s Restaurant POS
Let's be honest, calculating all these ratios by hand is a nightmare. It's tedious, prone to errors, and pulls you away from what you do best: running your restaurant. A modern, all-in-one restaurant POS is your best friend here. We designed TackOn Table to turn complex data into simple, actionable insights that you can see right on your dashboard. Our unique advantage lies in affordability, simplicity, and adaptability for your unique needs.
Think of TackOn Table as your restaurant's financial co-pilot. It automatically tracks your sales, inventory, and labor data, giving you a real-time view of your key ratios without you ever having to open a spreadsheet.
Our platform gives you the clarity you need to make smarter decisions, whether you run a bustling coffee shop, a popular food truck, or one of the many full-service restaurants trying to stand out. With a simple setup, mobile POS capabilities, and multi-location control, you can keep an eye on performance and boost profitability from anywhere.
Ready to see how easy data-driven management can be?
Book a Demo
Mastering Your Prime Cost and Other Key Expense Ratios
In the restaurant business, your two biggest line items are always food and labor. No surprise there. When you combine them, you get your prime cost—arguably the single most important number you need to track for survival, let alone profitability.
Getting a handle on your prime cost isn't just about good accounting; it's the bedrock of a financially sound restaurant. When you master this metric and its two core components, you gain direct, meaningful control over where your money is going.
Let's break down the formulas and benchmarks that really matter. This quick visual helps show how your main costs, profitability, and day-to-day efficiency are all deeply connected.

As you can see, true business health comes from a balanced approach—keeping costs in check while pushing for better profits and smoother operations. The right tools make this balancing act a whole lot simpler.
Here’s a quick-reference table to keep these essential cost metrics front and center.
Essential Cost Control Ratios and Industry Benchmarks
This table gives you a snapshot of the most critical cost ratios, their formulas, and the ideal industry benchmarks you should be aiming for.
| Ratio | Formula | Ideal Benchmark Range |
|---|---|---|
| Food Cost % | (Cost of Goods Sold / Total Food Sales) x 100 | 28% – 35% |
| Labor Cost % | (Total Labor Cost / Total Sales) x 100 | 25% – 35% |
| Prime Cost % | (Prime Cost / Total Sales) x 100 | Under 60% |
Think of these numbers not as rigid rules but as guideposts. They tell you where to look when something feels off in your financial performance.
What Is Your Food Cost Percentage?
Your food cost percentage tells you exactly how much of a menu item's price is eaten up by the cost of its ingredients. It’s a raw, direct measure of your menu's profitability. A high food cost can be a red flag for a few different things: maybe your supplier pricing has crept up, your portion control is slipping, or you've got a waste problem in the kitchen.
The calculation is simple:
Food Cost % = (Cost of Goods Sold / Total Food Sales) x 100
To get your Cost of Goods Sold (COGS), you take your beginning inventory, add any new purchases you made, and then subtract your ending inventory for that period. Most restaurants aim for a food cost percentage somewhere between 28% and 35%. Of course, this can swing depending on your concept—a high-end steakhouse will naturally have a higher food cost than a neighborhood pizzeria.
This number is absolutely essential for pricing your menu correctly. If a dish's food cost is way too high, you're either not charging enough or you're spending too much to make it. Tools with built-in inventory management, like TackOn Table, can track ingredient costs in real time, making these calculations automatic and flagging unprofitable items before they do real damage to your bottom line.
Calculating Your Labor Cost Percentage
Labor is your other beast of an expense. This ratio shows what chunk of your revenue is going directly to paying your team, which includes everything from salaries and hourly wages to payroll taxes and benefits. It's a vital sign of your scheduling efficiency and overall staff productivity.
Here’s the formula:
Labor Cost % = (Total Labor Cost / Total Sales) x 100
Ideally, you want to keep your labor cost percentage between 25% and 35% of your revenue. Just like with food costs, this benchmark can shift based on your service model. A quick-service spot with a simple counter setup will have much lower labor costs than a fine-dining restaurant with a full front-of-house army.
If you see your labor cost climbing, it might mean you're overstaffed during lulls or your team isn't bringing in enough sales per hour to justify the cost. A powerful Restaurant POS like TackOn Table provides the kind of detailed sales reports you can lay right over your labor data, helping you build smarter, more profitable schedules.
The All-Important Prime Cost
This is the big one. Prime cost bundles your food and labor costs together to give you a complete picture of your most significant operational expenses. Think of it as the ultimate health check for your restaurant's core profitability.
The formula is straightforward:
Prime Cost = Cost of Goods Sold + Total Labor Cost
To turn that into a truly useful ratio, you just express it as a percentage of your total sales:
Prime Cost % = (Prime Cost / Total Sales) x 100
For most restaurants, a healthy prime cost is 60% or less of total sales. If your prime cost starts creeping above that magic number, your profit margin is in serious trouble. It's a clear signal to dig in and figure out if the problem is coming from your food costs, your labor spending, or a bit of both.
Profit margins are notoriously thin and vary wildly across the industry, which really underscores the need for tight cost control. For example, full-service restaurants often operate on slim profit margins between 3% to 5%. In contrast, fast-casual concepts can hit higher margins of 6% to 9%, mostly thanks to their operational efficiency and lower labor needs. You can explore more financial benchmarks for restaurants to see how keeping a firm grip on prime cost directly fuels these margins.
Instead of wrestling with messy spreadsheets, imagine having these critical numbers updated for you on a single, clean dashboard. TackOn Table, a leading Toast vs Clover alternative, was built exactly for this. Our all-in-one platform gives independent restaurants the simplicity and affordability they need to stay on top of their numbers without the headache.
Ready to take control of your costs and boost your profits?
Start Your Free Trial Today
Tracking Your True Restaurant Profitability
Getting a handle on your food and labor costs is the defensive game in the restaurant business. But tracking profitability? That's your offense. Once you’ve wrestled your prime cost into a healthy range, it’s time to shift your focus from what you spend to what you actually keep.
This is where you measure the real financial pulse of your restaurant.
Two of the most telling numbers in this industry are Gross Profit Margin and Net Profit Margin. They might sound similar, but they tell completely different stories about your business's health. Think of it this way: Gross Profit shows you how healthy your menu is, while Net Profit shows you how healthy your entire operation is.
Understanding Gross Profit Margin
Your Gross Profit Margin answers a simple but critical question: how much money are you making from your food and drinks before paying for anything else? It’s your total sales minus the direct cost of the ingredients—your Cost of Goods Sold (COGS).
This metric is your go-to for evaluating menu pricing and kitchen efficiency. A strong gross margin means your dishes are priced well against what they cost to make.
The formula is straightforward:
Gross Profit Margin = [(Total Revenue – COGS) / Total Revenue] x 100
Let’s put that into practice. Say your café generated $20,000 in sales last month and your COGS was $6,000. Your gross profit is $14,000, which makes your Gross Profit Margin a very healthy 70%. This means for every dollar you bring in, you have 70 cents left over to cover labor, rent, utilities, and everything else before you can call it profit.
A low gross margin is a huge red flag. It could point to anything from inefficient ordering and food waste to menu items that are just priced too low to begin with.
Calculating Net Profit Margin
Now, let's get to the bottom line—literally. Net Profit Margin is the ultimate measure of success. It shows you the percentage of revenue left after every single expense has been paid, not just your food costs. This includes labor, rent, marketing, utilities, insurance, and taxes.
It answers the most important question of all: Is my restaurant actually making money?
Here’s the formula:
Net Profit Margin = (Net Profit / Total Revenue) x 100
Let's stick with our example. You started with a $14,000 gross profit. From that, you paid $11,000 in other operating expenses like payroll and rent. That leaves you with a net profit of $3,000. So, your Net Profit Margin is 15% ($3,000 divided by $20,000).
For context, a typical restaurant’s net profit margin hovers between 3-5%, so hitting 15% would be absolutely phenomenal.
Understanding these numbers is vital for long-term survival. Financial ratios help restaurant owners measure performance and keep a close eye on cash flow. For instance, top-performing U.S. restaurant chains often report EBITDAR margins (a specific profitability metric) between 16% and 27%, signaling incredible financial stability. By tracking your figures just as closely, you can make smarter decisions on everything from staffing to marketing. Discover more insights about restaurant financial strength.
From Ratios to Real-World Decisions with Café Management Software
Knowing your profitability ratios is one thing. Acting on them is what really moves the needle. This is where having a system like TackOn Table provides the clarity you need to make confident decisions.
- See an unprofitable menu item? Jump into our menu management tools to tweak the price or engineer a more profitable version of the dish.
- Notice your net profit is slipping? Dive into your labor reports to find opportunities for optimizing schedules and cutting down on overhead.
- Wondering how small changes might add up? You can plug numbers into our simple restaurant savings calculator to project the financial impact of becoming more efficient.
TackOn Table is designed to be more than just a point of sale. It’s an all-in-one management platform built with the simplicity and affordability that independent restaurants deserve. As a leading Toast vs Clover alternative, we provide powerful, easy-to-understand analytics without the high price tag or steep learning curve.
Ready to see your true profitability and start making decisions driven by data, not guesswork?
Book Your Free Demo Today
Getting Your Operations Running Like a Well-Oiled Machine
A profitable restaurant is more than just great food and smart cost control—it’s about having a smooth, efficient operation. Once you've got a handle on your prime costs and profit margins, it's time to zero in on how effectively your team, space, and inventory are actually making you money. These are your operational efficiency ratios.
Think of it like a pit crew in a race. It doesn't matter how powerful the engine is if the pit stops are slow and sloppy. Operational efficiency is your pit crew, making sure every part of your business is firing on all cylinders.
Keeping an eye on these numbers tells the real story of your day-to-day grind, pointing out bottlenecks and hidden opportunities you might otherwise miss.
Are You Turning Inventory Into Cash or Waste?
That food sitting on your storeroom shelves isn't just inventory; it's cash tied up. The Inventory Turnover Ratio is a crucial metric that tells you how many times you sell through your entire stock of food and drinks in a given period. A healthy turnover rate means cash is flowing freely and your ingredients are always fresh.
The formula is pretty simple:
Inventory Turnover = Cost of Goods Sold (COGS) / Average Inventory
To get your average inventory, just add the value of your inventory at the beginning and end of the period, then divide by two. Most restaurants should aim for an inventory turnover of 4 to 8 times per month. This sweet spot means you’re essentially using and replacing your entire stock about once a week—a fantastic sign of fresh food and smart purchasing.
A low number (say, below 4) is a big red flag. It probably means you're over-ordering, which can lead to spoilage and wasted cash. On the flip side, a number that's too high might mean you're cutting it too close, risking 86'ing popular dishes and disappointing guests.
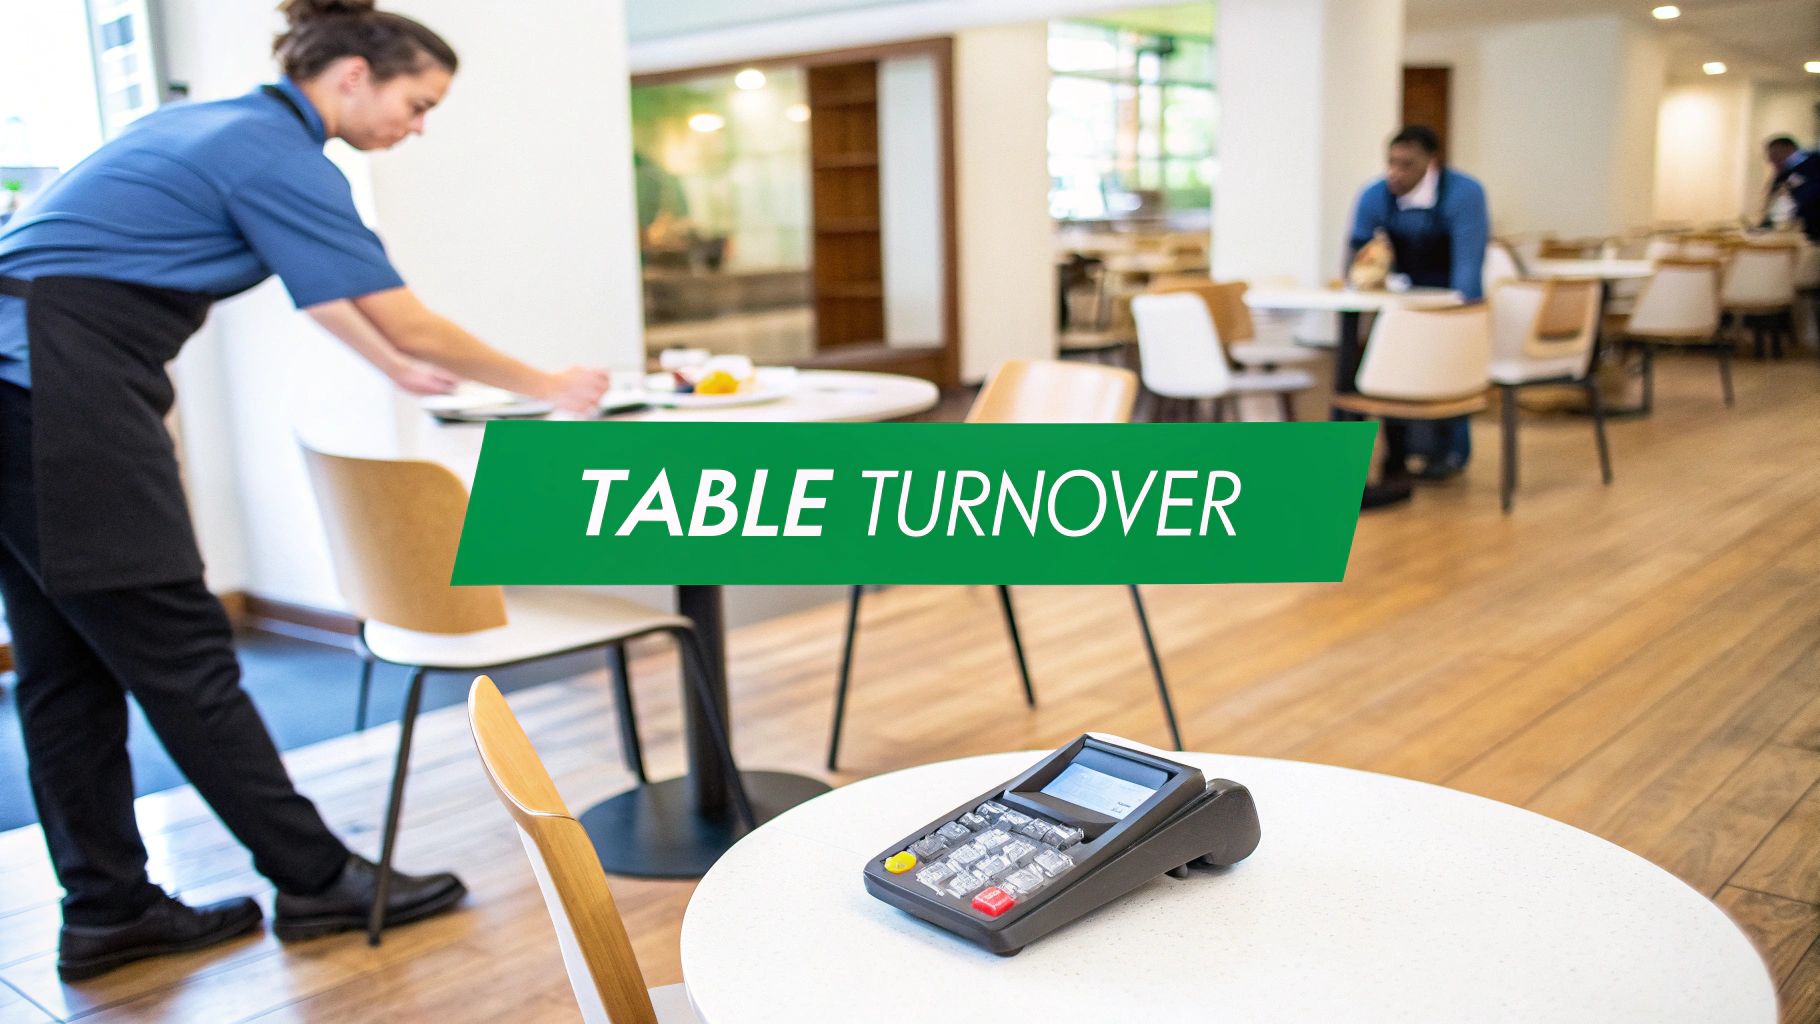
How Quickly Are You Turning Your Tables?
In a full-service restaurant, tables are your most valuable real estate. The Table Turnover Rate measures how many different parties you seat at a single table during a specific time, like a dinner service. The higher the rate, the more guests you're serving and the more revenue you're generating from your dining room.
Here’s the calculation:
Table Turnover Rate = Number of Parties Seated / Number of Tables
Let's say you served 90 parties during dinner and you have 30 tables. Your table turnover rate is 3. This means, on average, each table was used by three different groups of customers that night. Of course, this number will look very different depending on your concept—a fast-casual spot will turn tables much faster than a fine-dining restaurant.
If your turnover is sluggish, it's time to look for bottlenecks. Are tickets getting bogged down in the kitchen? Is your payment process slow and clunky? Bringing in a modern mobile POS system like TackOn Table allows servers to take orders and process payments right at the table. This one change can dramatically speed up service and help you get the next guests seated faster.
Is Your Team as Productive as They Can Be?
Your staff is your greatest asset, but labor is also one of your biggest costs. Sales per Labor Hour (SPLH) is a powerful metric that cuts right to the chase: how much revenue does each employee generate for every hour they work? It’s a direct measure of your team’s efficiency and how well you’re scheduling.
The math is straightforward:
Sales per Labor Hour = Total Sales / Total Labor Hours Worked
Imagine your restaurant did $5,000 in sales yesterday, and your team worked a combined 100 hours. Your SPLH would be $50. This number helps you pinpoint your most productive shifts. If SPLH consistently dips during certain times, it's a clear sign you might be overstaffed and can adjust your schedule to save on labor costs.
Key Insight: Boosting your operational ratios isn't about rushing guests out the door. It's about removing friction—in the kitchen, on the floor, and at the point of payment—to create a smoother, more enjoyable experience for everyone.
For operators with more than one location, trying to track these ratios across different restaurants can feel overwhelming. TackOn Table’s multi-location control dashboard brings everything into one place, giving you a unified view of your entire operation. You can compare inventory turnover, table turns, and SPLH across all your locations in real time to see who’s knocking it out of the park and share those winning strategies with the whole team.
This level of insight, combined with our easy setup, gives you the tools to fine-tune your operations for peak profitability.
Ready to turn your operational data into your biggest advantage?
Start Your Free Trial
Using a Modern Restaurant POS to Improve Your Ratios
Knowing your numbers is one thing, but actually improving them is a whole different ballgame. Finding out your food cost is 38% doesn't magically make it drop. This is where the right technology steps in, bridging that crucial gap between seeing the data and making a real difference in your profitability.
Think of a powerful restaurant POS system as the central nervous system of your operation. It connects every part of your business, from the front of house to the back. It takes the grueling, manual work of tracking ratios and turns it into an automated, real-time process. Suddenly, you have the power to make sharp, fast decisions that directly boost your bottom line.
This isn’t about just collecting numbers for the sake of it. It’s about putting that information to work. An all-in-one platform like TackOn Table gives you the tools to take immediate and effective action.
Slash Food Costs with Real-Time Inventory Control
Your food cost is probably the most volatile number you deal with. Ingredient prices are always shifting, portion sizes can get inconsistent, and waste has a nasty habit of quietly chewing up your margins. TackOn Table’s real-time inventory tracking gives you a firm grip on this critical expense.
As soon as an order is placed, the system automatically deducts the ingredients from your stock. This means you always have an accurate, up-to-the-minute view of what’s on your shelves, which helps stop over-ordering and cuts down on spoilage.
- Variance Alerts: Get an instant heads-up when your physical stock count doesn't line up with what your sales data says it should be. This helps you spot problems like over-portioning or even theft right away.
- Low-Stock Reminders: You can set reorder points for your key ingredients to automate purchasing, ensuring you never 86 a bestseller during the Saturday night rush.
By letting the system handle these tedious tasks, you can go after the root causes of high food costs and hang on to more of the profit from every plate that leaves your kitchen.
Optimize Labor Spending with Smarter Scheduling
Labor is the other heavyweight expense, and getting it right is the key to a healthy prime cost. Just cutting hours is rarely the answer—that can tank service quality and destroy team morale. The real solution is building smarter schedules based on actual performance data.
TackOn Table generates detailed sales reports that show you your busiest and slowest hours with crystal clarity. When you lay this sales data over your labor reports, you can:
Pinpoint your most productive shifts and team members, which lets you build schedules that squeeze the most out of your sales per labor hour (SPLH).
Avoid having too many people on the clock during slow periods, stopping unnecessary labor costs from nibbling away at your net profit.
This data-driven approach means you have the right people on the floor at the right times, creating a perfect balance between top-notch service and financial smarts. It’s a level of control that you just can't get with a paper schedule. For a deeper look at how modern systems compare, check out our guide on TackOn Table vs. Clover and Square.
Boost Efficiency with Mobile POS Technology
Slow service doesn't just annoy your guests; it actively damages your operational ratios. Every minute a table sits there waiting to order or pay is a minute that table isn't making you money. This is where mobile POS technology completely changes the game for your table turnover rate.
When you equip your servers with TackOn Table’s handheld POS devices, you give them the tools to work smarter, not harder.
- Orders are fired directly to the kitchen right from the tableside. This gets food cooking faster and slashes the potential for human error.
- Payments can be processed right at the table, which cuts out all those trips to and from a fixed terminal and makes the final part of the meal quick and seamless.
This streamlined flow means guests get served faster, your team can handle more tables, and your dining room generates more revenue every single hour. It’s a simple change that delivers a massive boost to your efficiency. TackOn Table provides these advanced tools with an easy setup and affordable price, making it an ideal Toast vs Clover alternative for restaurants that value simplicity and power.
Ready to stop just tracking your numbers and start actively improving them?
Don't Let Your Numbers Lie to You: Common Analysis Traps to Avoid
Having all the data in the world won't help if you're not reading it right. This is where many restaurant owners stumble. They see a number, jump to a conclusion, and make a change that doesn't actually fix the root problem. Let's walk through some of the most common traps so you can steer clear of them.
The most frequent mistake? Getting tunnel vision on a single metric. You might see your food cost creep up by half a percent and immediately start thinking about cutting portion sizes or switching suppliers. But in doing so, you could completely miss that your table turnover has tanked, which is a much bigger threat to your bottom line. No single number ever tells the whole story.
Forgetting to Ask "Why?"
Another classic pitfall is looking at a number in a vacuum. A sudden jump in your labor cost percentage might set off alarm bells. But what if that jump happened during the busiest holiday weekend you've ever had, when sales were through the roof? In that context, higher labor spending isn't a problem; it's the cost of capitalizing on a huge success. You always have to understand the context.
The key is to look for trends, not just snapshots in time. How does this Friday's performance compare to the last four Fridays? What about this time last year? Consistent analysis is what separates a knee-jerk reaction from a smart business decision.
At TackOn Table, we designed our dashboards specifically to combat these blind spots. We lay out your key industry ratios for restaurants right next to each other, so you get a complete picture of your restaurant's health without having to piece it all together yourself.
This approach helps you see the connections instantly. You can spot how a bump in marketing spend affected your average check, or how a new menu item is impacting your gross margin. It’s all about making balanced, informed decisions.
We take the guesswork out of the equation. As a powerful yet affordable café management software, our platform gives you the clarity you need to act with confidence.
Ready to see your numbers in a whole new light?
Frequently Asked Questions About Restaurant Ratios
Let's dig into some of the questions I hear most often from restaurant owners trying to get a handle on their numbers.
What's the One Number a New Restaurant Absolutely Must Watch?
If you're just starting out, your world should revolve around one key figure: Prime Cost. This is the combination of your food and labor costs—your two biggest, most volatile expenses.
Getting this right from the beginning is everything. If you can keep your Prime Cost below 60% of your total sales, you're giving yourself a real fighting chance to build a profitable business. It's the truest early signal of your restaurant's long-term health.
How Often Should I Be Looking at These Ratios?
Think of it like checking the engine of a race car. You don't wait for it to break down.
Your most critical operational numbers, like food and labor cost percentages, need a weekly check-in. This lets you spot a problem—like a sudden spike in chicken wing prices or a week of overstaffing—and fix it before it torpedoes your whole month.
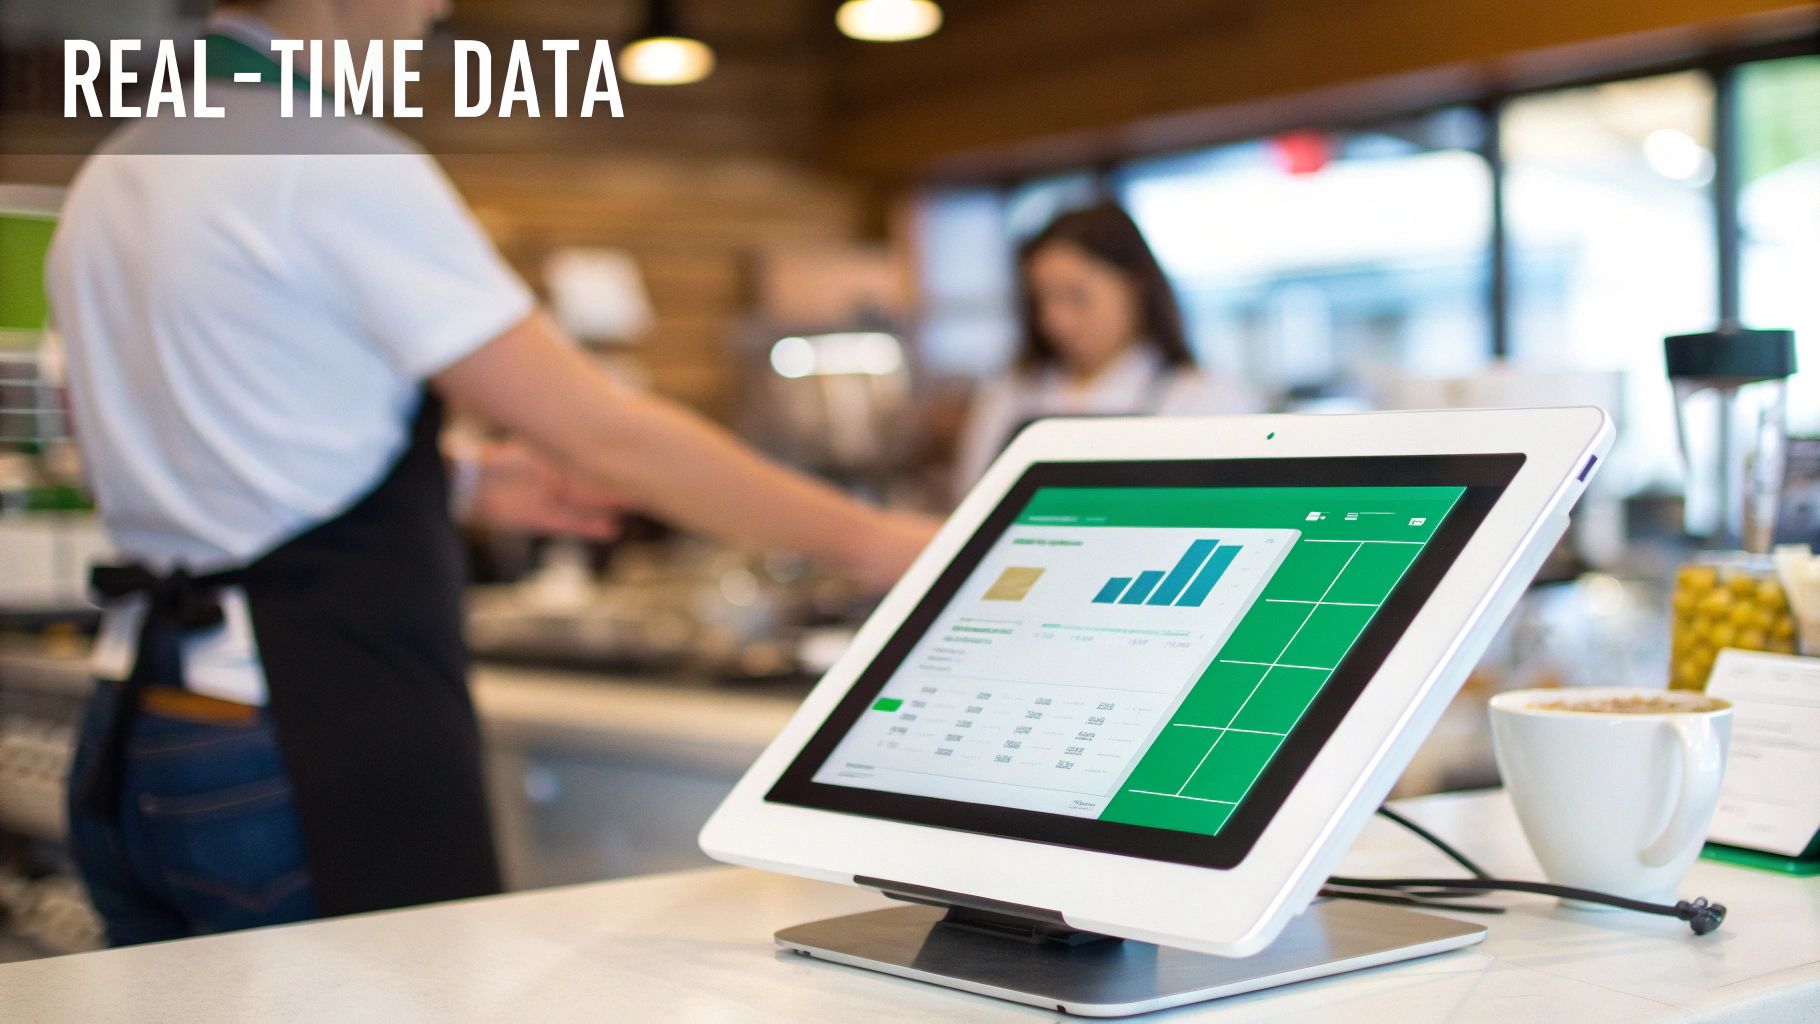
Bigger-picture profitability ratios can be reviewed monthly as part of your regular financial analysis. Of course, a modern Restaurant POS like TackOn Table changes the game entirely by putting this data on a real-time dashboard. You always know where you stand.
An all-in-one platform turns guessing into data-driven decision-making. It automates inventory tracking to lower food cost, helps with smart scheduling to optimize labor cost, and speeds up service to increase table turnover.
Can a Good POS System Really Make a Difference in My Ratios?
Without a doubt. A solid, intuitive POS isn't just for taking orders; it's the brain of your operation. It gives you the live data you need to manage your costs and run a more efficient floor.
As a leading Toast vs Clover alternative, TackOn Table was built to be both powerful and straightforward. It's designed to help you improve every key ratio—from food cost to table turns—all from one platform. With its mobile POS capabilities, easy setup, and multi-location management, you get the tools you need to grow your business intelligently.
Ready to stop guessing and start knowing your numbers? TackOn Table provides the clarity and control you need to boost profitability and streamline operations.
See how TackOn Table works for your restaurant. Same-day call →