


Think of a point of sale report as less of a simple transaction summary and more of a detailed check-up for your restaurant's health. It’s the story of your business, told through hard data, showing you exactly what’s selling, when you’re slammed, and where your real profits are coming from.
Why Your POS Report Is Your Most Valuable Asset
Ever have that feeling? You're running a packed restaurant, the energy is high, but when you look at the books, the profits just don't seem to match the hustle. You're definitely not alone. Too many owners run on gut instinct, but the real answers are already sitting right there in your POS data.
This report isn't just another spreadsheet filled with numbers to sift through. It’s an action plan in disguise, waiting for you to read it.
Modern restaurant management software, like TackOn Table, is built to turn that mountain of data into simple, visual insights you can actually use. Thanks to our all-in-one simplicity, you get a crystal-clear picture of how your business is performing instead of getting lost in raw numbers. This is the critical shift—from guessing to knowing—that separates the restaurants that just get by from the ones that truly thrive.
The Story Your Data Tells
See your POS report as a diagnostic tool. It’s designed to pinpoint specific problems and uncover hidden opportunities that are easy to miss in the day-to-day chaos of service. A good point of sale report can tell you things like:
- Peak Performance Hours: Nail down your busiest rushes to the hour. This lets you schedule staff perfectly and make sure your kitchen is prepped and ready.
- Menu Winners and Losers: Instantly see which dishes are flying out of the kitchen and which ones are just gathering dust. This is your guide to engineering a more profitable menu.
- Staff Productivity: Track sales by employee to celebrate your star performers and spot who might need a bit more coaching.
- Payment Trends: Find out how your customers like to pay. This can influence everything from your tech stack to your marketing promotions.
A powerful point of sale report does the hard work for you, piecing together every single transaction to reveal the bigger picture. With TackOn Table's all-in-one system, this information lands right on your mobile POS in real-time. You get the power to make smart, informed decisions on the fly, wherever you are. This is what makes TackOn Table such a compelling Toast vs Clover alternative for owners who need simplicity and direct control.
Ready to find out what story your sales data is trying to tell you? Let TackOn Table turn your numbers into a clear roadmap for growth.
Book a Demo
Decoding the 5 Essential Restaurant POS Reports
Drowning in data? It's a common feeling, but you don't need a degree in data science to get a handle on your restaurant's performance. The secret is knowing which numbers actually matter. For any café, food truck, or full-service restaurant, your Restaurant POS system is the command center for making smarter decisions.
Let's cut through the noise and zero in on the five essential reports that tell you what's really going on. These are the tools that turn raw data into a clear roadmap for profitability. Learning to read them gives you the kind of sales insights that are the true foundation of a successful restaurant.
To help you get started, this table breaks down which reports solve which problems.
Essential POS Reports and the Problems They Solve
This table summarizes the key types of POS reports and the specific business challenges they help restaurant owners address.
| Report Type | Key Metrics Included | Business Problem Solved |
|---|---|---|
| Sales Report | Total Sales, Net Sales, Sales by Daypart, Payment Type Totals | Understanding daily/weekly performance and identifying peak business hours. |
| Product Mix (PMIX) | Item-by-Item Sales Volume, Category Performance, Revenue per Item | Figuring out which menu items are hits and which are misses to optimize the menu. |
| Labor Report | Hours Worked, Overtime, Sales Per Labor Hour (SPLH), Labor Cost % | Controlling payroll costs and creating more efficient staff schedules. |
| Inventory Report | Stock Levels, Ingredient Usage, Food Cost Percentage, Waste/Spoilage | Preventing stockouts, reducing food waste, and controlling cost of goods sold. |
| Payments & Refunds | Voids, Comps, Discounts, Totals by Tender Type (Cash, Credit) | Ensuring cash drawers are accurate and tracking the financial impact of discounts. |
Think of these reports as different chapters in your restaurant's story. Each one reveals something new and helps you write a more profitable ending.
1. The Sales Report: Your Daily Scorecard
Your sales report is the quickest health check you can run on your business. It’s not just a grand total; it’s a detailed breakdown of your revenue over any period you choose—an hour, a day, a week, or even a month. Think of it as your daily scorecard, telling you exactly how you performed.
This is where you find the answers to crucial questions like:
- What were my total sales during the lunch rush?
- How did this Saturday's revenue compare to last Saturday's?
- Are customers paying more with credit cards or mobile payments?
With a modern POS like TackOn Table, these insights are available in real-time. You can instantly see your net sales, taxes collected, and tips earned, which means you can make on-the-fly adjustments instead of waiting until the end of the month to figure out what went wrong.
2. The Product Mix (PMIX) Report: Your Menu's DNA
The product mix report, often called an item-level report, is where you discover your menu’s rockstars and duds. It lists every single item you sold and tells you exactly how many of each were purchased. This isn't just a popularity contest; it's a direct window into what your customers truly crave.
This report is your best friend when it comes to menu engineering. By seeing which dishes are high-volume sellers versus those that barely move, you can make strategic decisions. Maybe it's time to remove an unprofitable item, run a special on a popular dish, or create a new combo you know will be a hit.
This diagram shows how a single point of sale report provides a top-down view of your business, breaking down into sales, performance, and cost insights.
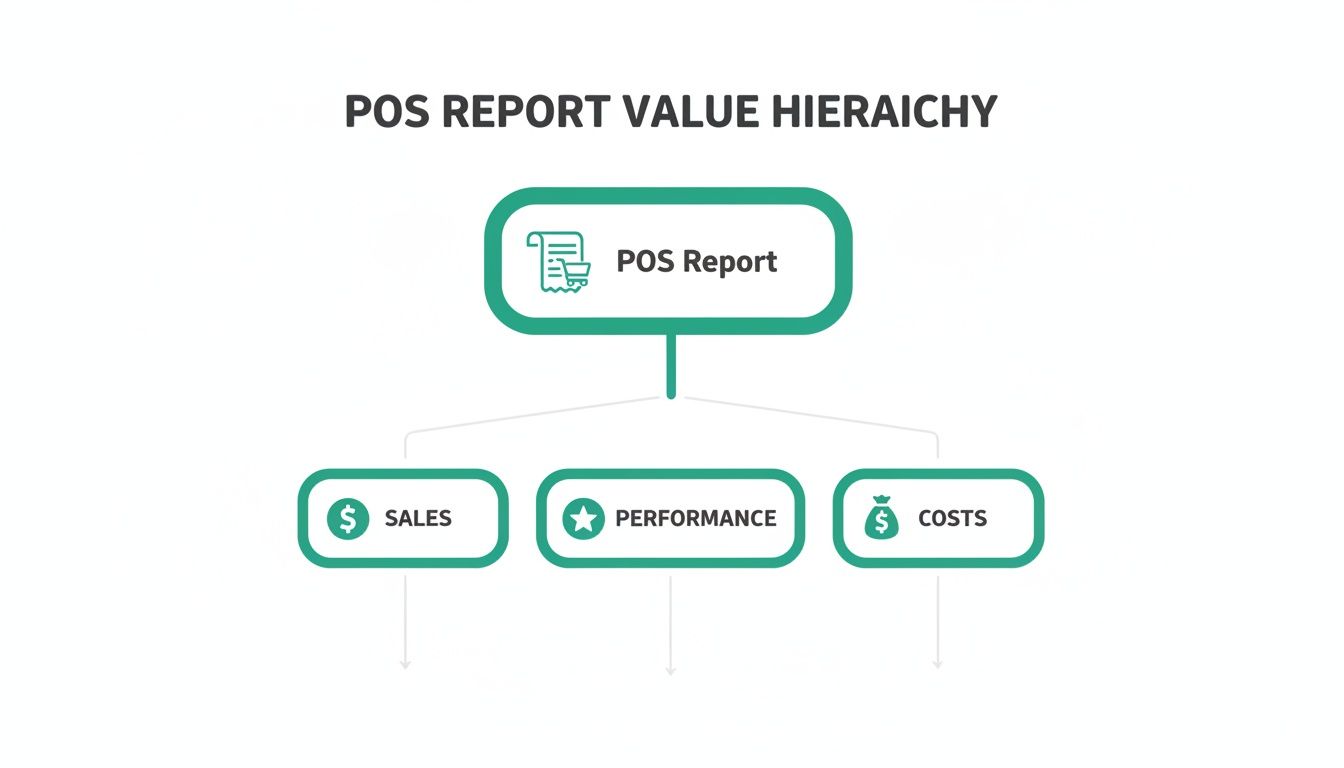
Ultimately, every report flows from this central source, giving you a complete picture of where your money comes from and where it goes.
3. The Labor Report: Your Team's Performance Snapshot
Payroll is one of your biggest expenses, and the labor report is your tool for keeping it under control. This report tracks everything from employee hours and overtime to sales per labor hour (SPLH)—a critical metric for measuring staff efficiency.
It helps you build smarter schedules based on actual sales data. That way, you have enough hands on deck for peak hours without burning cash on overstaffing during lulls. For those managing multiple locations, TackOn Table's centralized multi-location control provides a unified view, helping you maintain optimal staffing levels across all your restaurants.
4. The Inventory Report: Your Pantry Audit
Food cost is the silent profit killer. An inventory report acts as a digital pantry audit, tracking your stock levels in real-time. It connects what you sell with what you have on hand, helping you pinpoint waste, spot potential theft, and avoid the dreaded "86" on a key ingredient during a busy shift.
The demand for this kind of integrated data is why the global Point-of-Sale (POS) market was valued at USD 37.27 billion in 2025 and is projected to hit USD 124.73 billion by 2033.
5. The Payment Report: Your Cash Flow Compass
Finally, the payment report summarizes all transactions by how customers paid—cash, credit, debit, gift cards, and mobile payments. It’s essential for cashing out at the end of the day and for understanding your customers' payment habits. This report also tracks voids and comps, giving you a clear view of any discounts or errors.
With TackOn Table's simple, all-in-one system, these five reports are automatically generated and displayed on an easy-to-read dashboard. You get the insights you need without the headache.
Turning POS Data Into Profitable Actions
Data is just noise until you do something with it. Your point of sale report isn't just a jumble of numbers; it's a playbook for turning raw information into real-world profits. The real magic of a modern restaurant POS isn't just tracking sales—it's showing you why things are happening so you can make smart, decisive moves.
This is where you stop being a spectator and start actively shaping your business. Every metric and trend is an opportunity, and with the right system, those opportunities become crystal clear.
From Insights to Actionable Strategies
Let's break down a few practical scenarios that restaurant and café owners run into all the time. Think of this as translating a data point directly into a business decision, showing how a system like TackOn Table helps you react fast.
Scenario 1: The Tuesday Afternoon Slump
- The Data: You pull a sales report and notice a consistent dip every Tuesday between 2 PM and 4 PM. It’s a dead zone.
- The Action: Instead of just accepting it, you fight back with a targeted promotion. Jump into your POS and create a "Tuesdays Only" special for those exact hours, like a half-priced coffee with any pastry. Suddenly, your slowest period becomes a new revenue stream.
Scenario 2: The Unpopular Entrée
- The Data: Your item-level report shows the "Gourmet Lamb Burger" is your worst-selling entrée. At the same time, your inventory report flags its ingredients—ground lamb and artisan brioche buns—as having a painfully high food cost.
- The Action: This is a classic menu engineering puzzle. You could (A) kill the item and stop the financial bleed, (B) run it as a limited-time special to clear out pricey inventory, or (C) rework the recipe using more cost-effective ingredients.
TackOn Table's all-in-one simplicity means you can update your menu, create a promotion, and track its success from a single dashboard. This agility makes it a powerful Toast vs Clover alternative for operators who value immediate, actionable insights over complex systems.
Leveraging Data for Smarter Operations
Beyond the menu, your POS reports can help you fine-tune every part of your operation. It gives you the clarity to make confident decisions that directly boost your bottom line. To really get ahead, you have to turn that information into a strategic advantage. You can learn more about how AI turns raw data into actionable insights to see how modern tech is changing the game for restaurants.
Let's look at another common headache.
- Scenario 3: Inefficient Staff Scheduling
- The Data: Your labor report shows fantastic sales per labor hour on Friday nights but dismal numbers on Wednesday mornings. You're bleeding money by overstaffing during slow times and potentially frustrating customers by being understaffed during the rush.
- The Action: This data is your roadmap to a better schedule. You can confidently trim one front-of-house staffer from the Wednesday morning shift and add someone to Friday evening. This one change cuts payroll waste and improves service when it matters most.
This data-driven approach takes the guesswork out of running your restaurant, ensuring your resources are always put to the best possible use. Curious about the impact? You can even project potential gains with tools like our restaurant savings calculator.
TackOn Table is built to surface these trends and opportunities, turning your point of sale report from a backward-looking document into a forward-thinking strategy tool.
Ready to see your data in a new light?
Start Your Free Trial
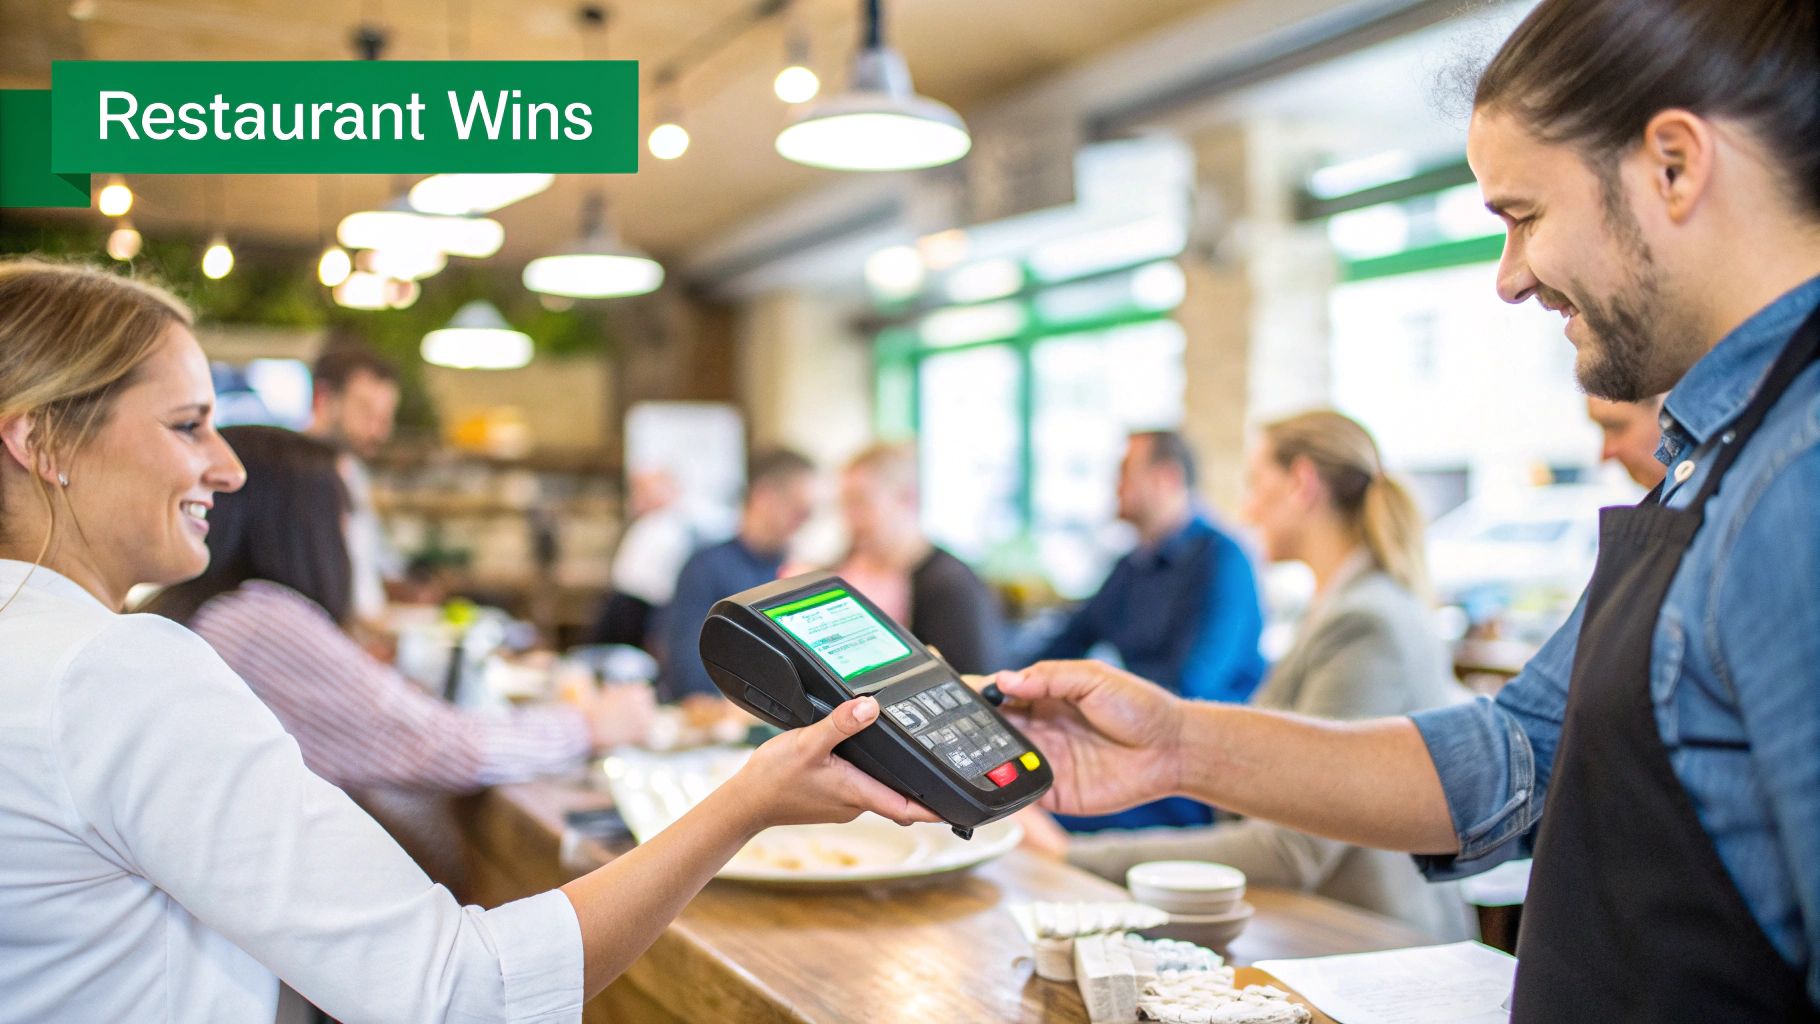
How Real Restaurants Use POS Reports to Win
It’s one thing to talk about data in theory, but it’s another to see it in action on the restaurant floor. Let's look at how two very different businesses—a busy quick-service café and a cozy full-service bistro—use the information from their POS to do more than just get by. These examples show how the right system delivers the specific insights each one needs to thrive.
Case Study 1: The Quick-Service Café
In a high-volume café, every second counts, especially during the morning chaos. The owner lives on their TackOn Table mobile POS, pulling up reports instantly from a handheld device.
Their go-to report? The product mix report. A weekly review revealed a fascinating tidbit: while single-shot lattes were popular, customers ordering a double-shot latte were 80% more likely to add a high-margin almond croissant. Acting on this, they bundled the two into a "Power Up Combo." It wasn't long before that combo became a morning best-seller.
They also keep a close eye on their inventory report to manage perishables like milk and pastries. This simple check-in allows them to fine-tune their daily orders, cutting food waste by over 15% in the first month alone.
Case Study 2: The Full-Service Bistro
A full-service bistro plays a different game. Here, success is about getting the most out of every table while creating a memorable experience. The manager is constantly digging into server performance and sales reports.
These reports help them track and coach upsells. They noticed that servers who mentioned the "wine of the week" when greeting a table sold 30% more bottles than those who waited. This simple data point led to a small tweak in the service script that boosted wine sales across the entire team. The bistro also uses TackOn Table’s reports to see how a modern full-service restaurant POS can pinpoint bottlenecks and shave precious minutes off table turn times on a slammed Saturday night.
A flexible POS with mobile ordering is no longer a "nice-to-have." By giving servers handheld terminals, both the café and the bistro can take orders and payments right at the table, which speeds everything up and drastically reduces errors.
This shift to mobile is huge. Handheld POS terminals are booming, grabbing an 18% application share in a market expected to skyrocket from USD 33.15 billion in 2025 to USD 89.52 billion by 2035. Wireless devices, like the ones TackOn Table provides, are what make this agility and the demand for contactless payments possible. You can read more about the explosive growth of handheld POS technology and how it’s changing the game.
Whether you're slinging coffee or crafting fine dining experiences, the right POS report gives you a roadmap to making smarter, more profitable decisions.
Ready to see what your data can do for you?
Choosing the Right Restaurant POS for Powerful Reporting
Let's be honest—not all POS systems are built the same, especially when it comes to reporting. An outdated or clunky system dumps a pile of messy data in your lap and expects you to figure it out. A truly modern POS, on the other hand, should be your business partner, translating all those complex numbers into a clear story you can actually act on.
When you're shopping for a system, you need one that can keep up with the pace of a real restaurant. Old-school, legacy systems are often slow and disconnected. A modern, cloud-based platform, however, makes sure your data is always live, secure, and accessible from anywhere. This isn't just a nice-to-have feature anymore; it’s the new standard for running a smart business.
Core Features of a Data-Driven Café Management Software
To get reports that genuinely help you grow, your Café Management Software or restaurant POS needs a few key things right out of the box. First and foremost, look for a clean, centralized dashboard. This is a game-changer if you run more than one location, letting you switch between a single store’s performance and the big picture without juggling a dozen different logins.
Here’s what you should be looking for:
- Real-Time Data Syncing: You need instant updates on sales, inventory levels, and labor costs that you can check from your phone or any device.
- Customizable Reports: The ability to filter and sort your data by date range, a specific employee, or menu category is crucial. It’s how you find answers to your most pressing questions.
- All-in-One Simplicity: Steer clear of systems that nickel-and-dime you with expensive add-ons for basic reporting. A unified platform like TackOn Table includes everything you need from the get-go.
It’s no surprise that cloud-based POS solutions are expected to capture over 70% of the market share by 2025. Restaurants everywhere are ditching rigid, on-premise hardware for more flexible systems that give them real-time access to their data. You can find more details on this shift in the booming cloud POS market statistics.
The TackOn Table Advantage: A Smarter Toast vs. Clover Alternative
Systems like Toast or Clover can be powerful, but they often come with a steep learning curve, a web of hidden fees, and a setup process that’ll give you a headache. We built TackOn Table as the answer to that needless complexity, delivering powerful reporting in a package that’s both affordable and incredibly easy to use.
Our philosophy is simple: you shouldn’t need to be a data analyst to understand your own business. TackOn Table presents key metrics in clean, visual reports that highlight what matters most, so you can make confident decisions fast.
With TackOn Table, you can have your entire system up and running in under 30 minutes. Its easy setup and all-in-one design means you won’t get hit with surprise costs for essential tools like inventory tracking or multi-location management. For a side-by-side look, check out our guide comparing TackOn Table vs. Clover and Square. We give you the robust, adaptable reporting you need, without all the extra baggage.
Ready to see how simple powerful reporting can be?
{“@context”: “https://schema.org”,”@type”: “FAQPage”,”mainEntity”: [{“@type”: “Question”,”name”: “How Often Should I Review My Restaurant POS Report?”,”acceptedAnswer”: {“@type”: “Answer”,”text”: “Think of it like checking different gauges on a dashboard. Some need a quick look every day, while others you'll want to study on a weekly or monthly basis. nn* Daily: A quick scan of gross sales, voids, and cash flow is a must. This helps you catch any immediate red flags, like a cash drawer that’s off or a strange spike in refunded orders. n* Weekly: This is the perfect time to look at sales trends, labor costs, and what your top-selling items were. You can use this info to make smart moves for the coming week, like adjusting staff schedules or running a special on a popular dish. n* Monthly: Zoom out for the big picture. This is when you tackle larger strategic decisions, like redesigning your menu, adjusting prices, or mapping out promotions for the next few months. nnA modern cloud-based system like TackOn Table gives you a live dashboard you can pull up anytime. That means you can check these crucial numbers from anywhere on your mobile POS, keeping you connected and in control.”}} ,{“@type”: “Question”,”name”: “Can a POS Report Help Me Reduce Food Waste?”,”acceptedAnswer”: {“@type”: “Answer”,”text”: “Absolutely. Your product mix report is your secret weapon against food waste. It’s a brutally honest look at what’s selling and, more importantly, what’s not. nnOnce you’ve pinpointed those menu items that are just sitting there, you can take action. Maybe the recipe needs a little work, or you could run a promotion to move that inventory. Sometimes, the best move is to just cut it from the menu altogether. nnBeyond that, a good inventory report ties your ingredient usage directly to sales. This connection is key for spotting operational hiccups like over-portioning or spoilage before they start draining your profits. TackOn Table's all-in-one platform makes this a breeze by automatically linking every sale to your real-time inventory levels.”}} ,{“@type”: “Question”,”name”: “What Is the Most Important Metric in a Sales Report?”,”acceptedAnswer”: {“@type”: “Answer”,”text”: “While Net Sales is a great at-a-glance health check, the real gold is often buried a little deeper. To get a true feel for how your restaurant is performing, you’ll want to focus on a few other key metrics: nn* Sales per Labor Hour (SPLH): This tells you how efficient your team is and is essential for building smarter schedules. n* Average Check Size: This is a fantastic indicator of how well your staff is upselling and enhancing the guest experience. n* Gross Profit Margin: This number cuts through the noise and shows you your actual profitability after you account for what the food costs. nn> A great POS doesn't just throw numbers at you; it shows you the story behind them. TackOn Table’s analytics are built to highlight these key insights automatically, turning raw data into a clear plan of action.”}} ,{“@type”: “Question”,”name”: “How Can POS Reports Help Manage Multiple Locations?”,”acceptedAnswer”: {“@type”: “Answer”,”text”: “For anyone running a multi-location operation, centralized reporting isn't just a nice-to-have; it's a must. A solid system like TackOn Table gives you a single command center to see reports for each location on its own or all together. nnThis lets you compare performance side-by-side, figure out the secret sauce of your top-performing store, and roll out those best practices across the board. You can monitor sales, inventory, and labor for all your restaurants in real-time without logging in and out of different systems. It’s that complete visibility that allows you to scale confidently and makes TackOn Table a powerful Toast vs Clover alternative for its simplicity and adaptability.”}}]}
Ready to turn your data into your biggest advantage? With TackOn Table, you get clear, actionable reports designed to help you grow, all on one simple and affordable platform.