

Think of every single transaction in your restaurant, café, or food truck—every coffee sold, every appetizer ordered, every bill paid. Each one is a tiny piece of a much larger story. Point of sale reports are how you read that story, turning raw transaction data into a clear, actionable picture of what's really happening in your business.
These reports, generated right from your POS system, break down everything from sales and inventory to employee performance. In a few clicks, they show you what's selling like hotcakes, who your top-performing servers are, and exactly where your money is going.
Why POS Reports Are Your Restaurant's Command Center
Imagine trying to fly a plane without an instrument panel. That's what running a restaurant without good data feels like. Your POS system is that command center, and its reports are the real-time dials and gauges showing you everything from ingredient levels to service speed and daily profits.
This isn't just about counting cash at the end of the night. It's about getting concrete answers to the questions that keep you up at night. Are those Tuesday lunch specials actually making you money? Is your weekend staff stretched too thin or over-scheduled? Which menu items are true stars, and which ones are just dead weight?
From Guesswork to Growth
Without solid data, managing a restaurant is a high-stakes guessing game. You might feel busy, but you can't be sure if that flurry of activity is actually leading to healthy profit margins. This is where a modern, adaptable POS system completely changes the game.
- It translates chaos into clarity, turning thousands of individual sales into simple charts and summaries.
- It backs your biggest decisions with facts, giving you the proof you need to refine your menu, build smarter staff schedules, and run promotions that work.
- It uncovers hidden trends, like a sudden spike in demand for a particular cocktail or a strange dip in sales during what should be a peak hour.
A great POS reporting system isn't just about crunching numbers. It’s your most valuable management tool, turning a constant stream of data into the clear, actionable insights you need for sustainable growth.
The industry gets it. The global POS terminal market is on track to hit an incredible $181.47 billion by 2030, a boom driven by businesses demanding smarter, more flexible ways to operate. For restaurant owners, this trend is great news—the tools for success are more powerful and accessible than ever. You can discover more insights about POS market growth here.
With an all-in-one system like TackOn Table, this data becomes simple and intuitive. We designed our platform for busy owners, not data scientists. Through our easy-to-use mobile POS and multi-location control dashboards, you get the critical insights you need, right when you need them, helping you build a stronger, more profitable business.
Essential Restaurant POS Reports Every Owner Needs
Feeling buried in spreadsheets and endless data points? It’s a common frustration. The secret isn't to chase down every single number, but to zero in on the handful of point of sale reports that actually move the needle for your restaurant, café, or food truck.
A few core reports give you the clearest picture of your operational health. Let's break down the essentials and turn that mountain of data into your new secret weapon.
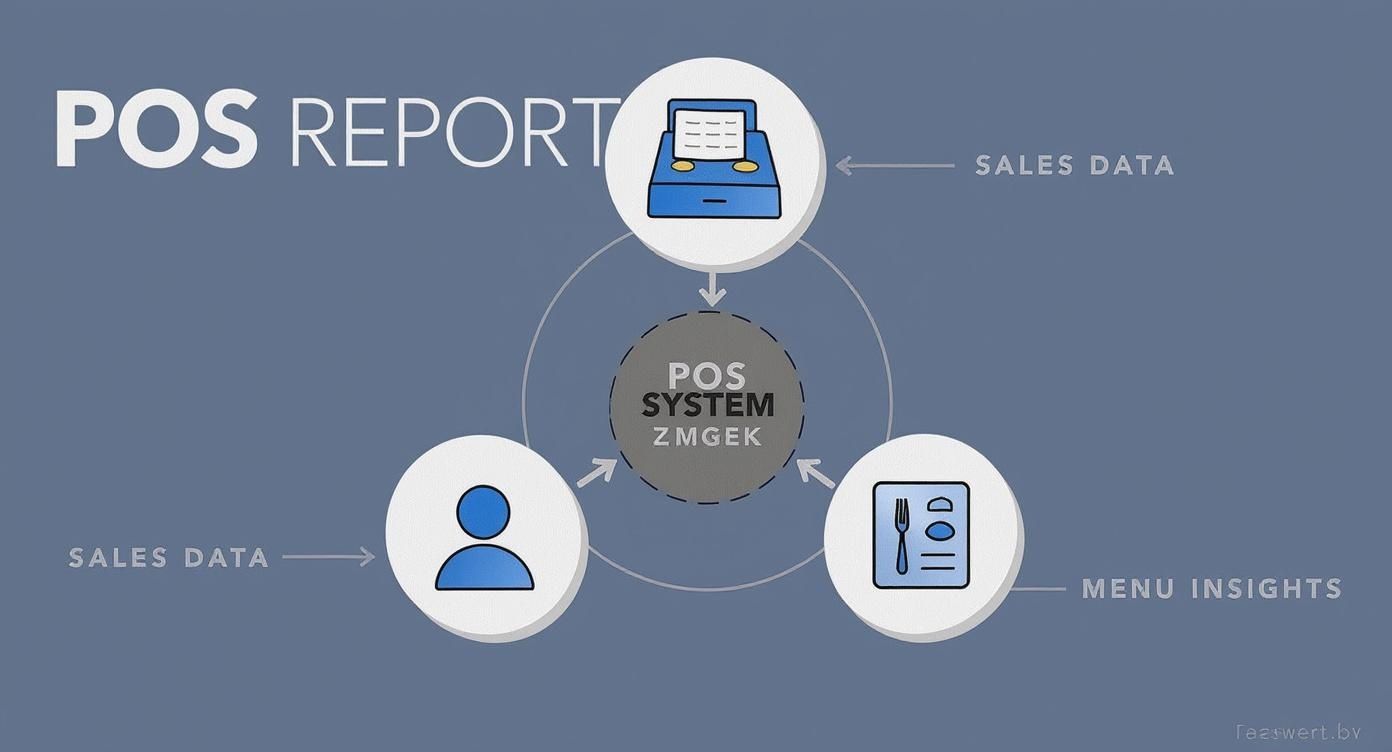
Think of your POS as the central hub of your operation. It's constantly collecting information from every transaction, connecting sales figures with staff activity and menu performance. Understanding this flow is the first step to making truly data-driven decisions.
To simplify things, here's a look at the most critical reports that will give you the biggest bang for your buck.
Key Restaurant POS Reports and Their Purpose
| Report Type | What It Tells You | Key Metrics to Watch |
|---|---|---|
| Sales Reports | The financial heartbeat of your business—how much you sold and when. | Net Sales, Sales by Hour/Day, Payment Method Breakdown |
| Product Mix (PMIX) | Which menu items are winners and which are dragging you down. | Item Popularity, Profit Margin per Item, Category Performance |
| Labor Reports | How efficiently you're staffing your restaurant against your sales. | Labor Cost Percentage, Sales per Labor Hour, Overtime Costs |
| Inventory Reports | The real story behind your food costs, from usage to waste. | Food Cost Percentage, Ingredient Usage, Stock Levels, Shrinkage |
These four reports provide a comprehensive look into the three pillars of your business: your sales, your menu, and your costs. Let's dive a little deeper into each one.
Sales Reports: Your Daily Pulse Check
Your daily sales report is more than just a grand total; it’s the rhythm of your restaurant. It gives you a quick, clean snapshot of your financial performance so you can see what’s happening day-to-day.
A modern POS system like TackOn Table puts these numbers right at your fingertips, in real-time. You can immediately see:
- Sales by Time Period: Is your lunch rush stronger than dinner? Knowing your peak hours is crucial for optimizing schedules and running targeted promotions.
- Payment Summaries: Are customers mostly using cards, cash, or mobile wallets? Keeping an eye on these trends helps you meet guest expectations and keep the checkout line moving.
- Net Sales vs. Gross Sales: This shows you the real impact of discounts, comps, and voids on your bottom line. It's the difference between what you could have made and what you actually took home.
Product Mix Reports: The Key to a Profitable Menu
Your menu is your number one sales tool. The product mix report (often called a PMIX report) is how you measure just how well it’s performing. This report breaks down every single item you sell, showing you what’s popular, what’s profitable, and—most importantly—what’s both.
It answers the big questions:
- Which dishes are your menu "stars" (high popularity, high profit)?
- Which items are "duds" (low popularity, low profit) just taking up space?
With this information, you can start doing some real menu engineering—a smart process of redesigning your menu to subtly guide customers toward your most profitable items. It's one of the fastest ways to boost your average check size.
Labor and Inventory Reports: Controlling Your Biggest Costs
For almost every restaurant, the two biggest expenses are always food and labor. Without a tight grip on them, these costs can spiral out of control and wipe out your profit margins.
Point of Sale data provides a microscope into your business performance. These reports cover everything from sales trends to product performance, but many owners feel overwhelmed and underuse this goldmine of information.
TackOn Table brings these critical numbers into one easy-to-read dashboard, so you're never in the dark.
- Labor Reports: Instantly see your labor cost percentage stacked up against your sales. This is your guide to building smarter schedules that prevent overstaffing during slow periods while ensuring you have enough hands on deck for the rush.
- Inventory Reports: Get a clear, honest look at your stock levels, how quickly you’re using ingredients, and your overall food cost percentage. This report is your best friend for cutting down on waste, avoiding the dreaded "86," and negotiating better deals with your suppliers.
By truly understanding these essential reports, you can stop reacting to problems and start making proactive, strategic decisions. This clarity is especially crucial for full-service restaurants, where tight margins mean every bit of efficiency counts.
Turning POS Data Into Profitable Decisions
Having a mountain of data is one thing, but knowing what to do with it is where the real money is made. Let's be honest, even the most detailed point of sale reports are worthless if they just sit there. They need to inspire action. This is where we connect the dots between the numbers on your screen and the smart, real-world decisions that grow your restaurant, café, or food truck.

Think of your reports as a strategic roadmap for your business. Instead of just glancing at sales totals, you can start asking pointed questions and let the data show you the way. When you have an intuitive, all-in-one system like TackOn Table, these insights become crystal clear, turning your POS from a simple payment machine into a genuine growth engine.
From Menu Insights to Menu Engineering
Your Product Mix (PMIX) report is the perfect place to start. This report does more than just tell you what’s popular; it shows you what’s actually profitable. Looking at this one report is the first step in the powerful process of menu engineering.
Let's walk through a quick example. Your PMIX report shows the "Spicy Burger" is flying out of the kitchen, but its profit margin is razor-thin because of expensive ingredients. Meanwhile, your "Gourmet Mac & Cheese" has a fantastic margin, but it barely sells.
What do you do? Here are a couple of data-driven moves:
- Rework the Underperformer: Could you give the Mac & Cheese a catchier name? Maybe feature it as a chef's special or train your servers to recommend it as a must-try signature dish?
- Adjust the Low-Margin Star: Is there a more cost-effective bun or cheese for the burger that doesn't sacrifice taste? Another idea is to package it in a combo deal to bump up the average ticket price.
These are the kinds of small, informed tweaks that can seriously boost your bottom line without needing a complete menu overhaul.
Optimizing Staffing with Hourly Sales Data
Few things kill profits and customer satisfaction faster than having too many staff members standing around or not enough when the big rush hits. Your hourly sales report is the key to getting your schedule just right.
By looking closely at your sales patterns, you can identify your true peak hours and slow periods with surgical precision. This lets you build smarter schedules that match labor costs directly to revenue. For businesses with multiple locations, TackOn Table's multi-location control makes it simple to analyze trends and roll out these scheduling insights everywhere.
Mini Case Study: A local café using TackOn Table saw from their reports that pastry sales fell off a cliff after 2 PM, even though coffee sales stayed steady. They trained their team to upsell a pastry with every afternoon coffee, even offering a small "afternoon special" discount. The result? They boosted their average check size by 15% in just one month.
That’s what this is all about—turning simple observations from your POS reports into strategies that work. It’s not about becoming a data scientist; it’s about using clear, accessible information to make confident decisions that move the needle.
Ready to see how simple, powerful reporting can transform your operations? Book a personalized demo and discover the TackOn Table difference.
Choosing Café Management Software with Powerful Reporting
Not all point-of-sale systems are created equal, especially when it comes to reporting. Some bury the data you need under confusing menus, while others make you pay extra for the most useful reports. Choosing the right restaurant POS is about finding a partner that translates all that raw data into clear, simple insights you can actually use—without giving you a headache.
Toast vs Clover Alternatives: Simplicity and Affordability
Many restaurant owners feel trapped by legacy systems that are clunky, expensive, and inflexible. When you start looking at modern Toast vs Clover alternatives, your focus should be on finding a solution that's simple, powerful, and doesn't break the bank. You need a system that feels like it’s on your team, not one you have to fight with every day.
The right POS system does more than just take payments; it tells you the real-time story of your business. It should make powerful reporting easy to understand for everyone, from an owner checking in from home to a manager running the floor.
This is exactly why we built TackOn Table. We designed our platform specifically for independent restaurant, café, and food truck owners. Our core belief is that you shouldn't need a huge budget or a data science degree to get powerful insights. We champion affordability, simplicity, and adaptability.
Non-Negotiable Reporting Features
As you’re weighing your options, make sure any café management software or restaurant POS you consider has these essentials built right in:
- Real-Time, Cloud-Based Access: Your business is always on, and your data should be too. You need to be able to pull up sales, labor, and inventory reports from your phone, tablet, or laptop, wherever you are.
- Intuitive Visual Dashboards: A spreadsheet full of numbers is tough to decipher on a busy Tuesday. Look for clean dashboards with graphs and charts that let you spot trends with a quick glance.
- Customizable Views: Your business is unique. Your POS should let you arrange your dashboard to highlight the Key Performance Indicators (KPIs) that matter most to your operation, front and center.
TackOn Table’s mobile POS and famously easy setup were designed for the reality of running a food business today. You're constantly moving, so your data should be able to keep up. Our system gives you immediate, powerful insights right on your phone, so you can make smart decisions on the fly.
Our platform gives you this modern power without the hidden fees and complicated setups you see elsewhere. For a direct look at how we compare, check out our TackOn Table vs. Clover and Square comparison.
Stop letting confusing reports get in the way of your growth. See for yourself how simple, powerful data can make a real difference.
Setting Up Your Reports for Maximum Insight
Your POS reports are powerful, but only if you actually use them. Just pulling up data when you sense a problem is a reactive move that almost always leaves money on the table. The real secret is to build a proactive habit, making your reporting dashboard a go-to tool for managing your restaurant smartly, day in and day out.
It all begins with setting up your system to show you what truly matters. With a flexible, adaptable platform like TackOn Table, you can customize your main dashboard to put your most important Key Performance Indicators (KPIs) front and center. That way, the numbers you need most are always visible at a glance, whether you're at your desk or checking in from your phone.
Building Your Reporting Rhythm
A great reporting strategy is all about consistency. Different reports offer different perspectives, so you need a review schedule that lines up with how your business actually runs. Think of it as a tiered system for keeping a finger on the pulse of your restaurant's health.
For most restaurants and cafés, a simple daily, weekly, and monthly cadence works wonders:
- Daily Check-In (5 Minutes): This is your quick, end-of-day pulse check. Pull up the daily sales summary, check for any unusual voids or discounts, and look at a quick labor snapshot. It’s the perfect way to spot immediate red flags, like a suspiciously high number of comps or a potential scheduling mess for tomorrow.
- Weekly Review (30 Minutes): Now you can dig a little deeper. Compare this week's sales against last week's, dive into your Product Mix (PMIX) report to see what’s selling (and what’s not), and review your total labor cost percentage. This is where you’ll start to see patterns emerge and can make smart tweaks for the coming week.
- Monthly Strategy Session (1-2 Hours): Time to zoom out and look at the big picture. How did this month stack up against last month? What about this time last year? This is when you should be analyzing inventory variance, overall food cost percentage, and customer trends to guide your bigger, long-term decisions.
Customizing Your TackOn Table Dashboard
Your business is unique, and your dashboard should be, too. A coffee shop owner might want to track sales per hour during the morning rush, while a fine dining restaurant will be more focused on table turnover times. TackOn Table's easy setup is designed to let you shape your main view around your specific goals.
The goal of a well-configured dashboard is to answer your most important questions in seconds. It should immediately tell you if you’re on track, where you’re winning, and which areas need attention right now.
With our all-in-one simplicity, you can just drag and drop widgets to showcase your top-selling menu items, see labor costs in real-time, or compare sales across different locations. This custom view means you’re not wasting time digging for the data you check every day. It’s all right there, helping you make faster, better-informed decisions.
Ready to see how simple it is to build a dashboard that actually works for you? Book a personalized demo and we’ll walk you through how TackOn Table puts your most critical business insights right at your fingertips.
Your Restaurant's Future is in the Data
Your point of sale reports aren't just a collection of numbers. Think of them as a living blueprint for building a smarter, more profitable restaurant. Digging into your sales, menu, and labor data is the secret to getting ahead—and staying there. It’s about replacing guesswork with real knowledge.
This is exactly why we built TackOn Table. We deliver these crucial insights in a way that’s affordable, simple, and genuinely powerful. It’s an all-in-one system designed for owners who are tired of being nickeled and dimed by complex platforms like Toast or Clover.
With our straightforward mobile POS, a setup process that’s famously easy, and seamless multi-location control, you get everything you need to make decisions with confidence.
Stop guessing about what’s working and start knowing. Your data holds the keys to boosting profits, streamlining your operations, and growing intelligently. You just need the right tool to unlock it.
Don't let another day go by in the dark. It’s time to experience the clarity and control that comes from having powerful, easy-to-understand reports at your fingertips. Take that first step toward a more secure and successful future for your business.
Ready to see how it all works? Start your free trial or book a personalized demo today and discover the TackOn Table difference.
FAQ: Point Of Sale Reports for Restaurants
Got a few lingering questions about getting the most from your point of sale reports? You're not alone. Here are some of the most common things we hear from restaurant and café owners, with straight-to-the-point answers.
How often should I check my restaurant POS reports?
The best approach is to build a simple habit. Spend 5 minutes every day glancing at your daily sales summary. Once a week, set aside 30 minutes to dig into your product mix and labor costs. Finally, block out an hour once a month to look at bigger trends and compare month-over-month performance. This rhythm keeps you informed without feeling overwhelmed.
Can POS reports genuinely help me reduce food waste?
Absolutely. Your inventory reports are the key. They provide a clear window into exactly what's being used and what's sitting on the shelf. By identifying slow-moving menu items, you can fine-tune your ingredient orders to prevent spoilage. This directly reduces food costs and stops you from throwing money in the bin.
Which report is most important for menu planning?
For menu engineering, the Product Mix (PMIX) report is your best friend. It shows you what people are actually buying and which of those dishes are making you the most money. This data allows you to strategically feature your "stars" (popular, profitable items) and either fix or remove the "duds" that are taking up space.
With TackOn Table, we present your PMIX data in a way that’s easy to read. You can see your winners and losers at a glance and make menu changes that you know will pay off.
Is my data secure with a cloud-based restaurant POS?
Yes. Reputable cloud-based systems like TackOn Table prioritize security. All your business data is protected with end-to-end encryption and stored on secure, professionally managed servers. In many ways, it’s significantly safer than keeping sensitive financial information on a local computer in your back office.
For more answers to common questions, feel free to check out our complete TackOn Table FAQs page.
Stop guessing and start knowing. TackOn Table delivers the clear, actionable reports you need to see what’s really happening in your business. Book a personalized demo and let us show you how simple it can be to boost profits and run a smarter operation.
See how TackOn Table works for your restaurant. Same-day call →